Clinical Pearls: Shock
“Would you like to add a second presser?” Not the best words to hear from the fast moving bedside staff. I look to the NP student and ask what they want to do, typically being met with a shoulder shrug and a “Vasopressin?” with a question mark in the voice. We’re good so far. Then I ask why they chose that drug and this is where the stalemate begins. It’s not intended to be a challenge, but an opportunity to assess the knowledge behind the choice. As long as you are making medical decisions based upon appropriate diagnoses and sound evidence all is good. There is no one right answer; most disease states have multiple approaches - your job as the provider is to decide what is the most right. Does this shed new light on all those infuriating “choose the most right answer” questions on nursing tests? In this article I’ll discuss shock classifications and how to differentiate.
Not that kind of shock
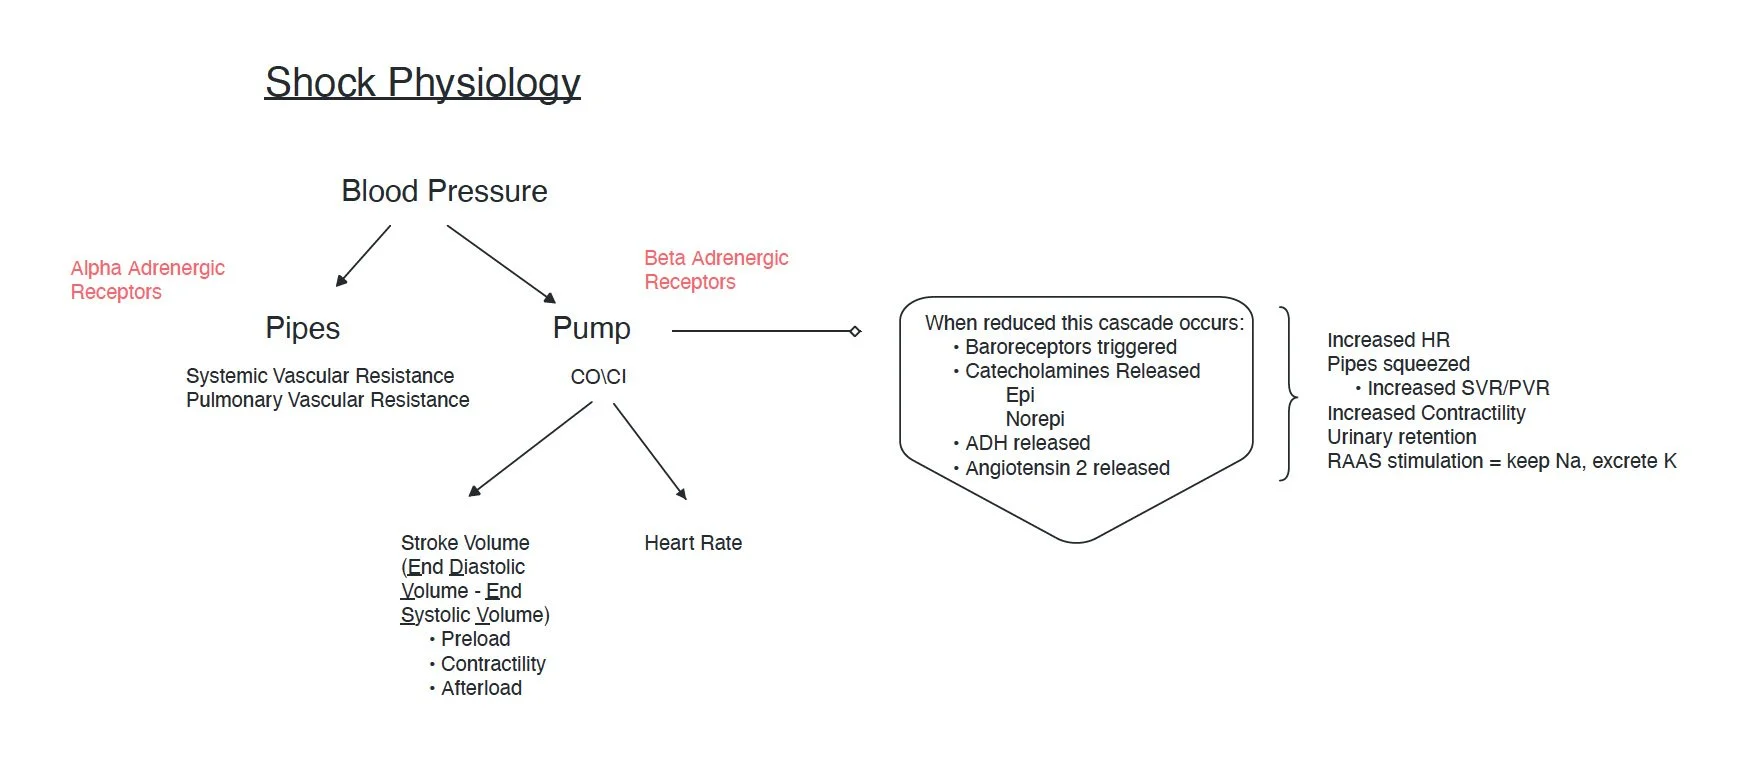
Let’s start with a basic pathophysiology review. I abhor when lectures start with equations but I can acknowledge that a general understanding of the components that contribute to a problem are a crux to deep comprehension. Therefore, I am sorry to inform you, but we will be starting with some equations 😫. The good news is, I present this as a visual (‘cause that’s how my brain works).
To appreciate that blood pressure is derived from a delicate balance between the pipes and the pump (this is how I think of it) let’s break down the factors. Perhaps the most complex of all is the Stroke Volume which is composed of preload, afterload, and contractility. The salient point in this graphic is understanding that when one component is altered the end product is affected. One must also appreciate that our inherently wise bodies do every thing possible to compensate for the alteration and therefore adapt the other component(s). For example, when the pipes are vasodilated, as in septic shock, the pump takes the easiest path to correction by increasing heart rate and/or SV. The final point to make here is the far right side of the image which shows the cascade of events that happen when cardiac output is low. That wise body does everything it can to correct for the state of poor perfusion: it hangs onto more water and sodium (and to keep electroneutrality excretes potassium) and ramps up the heart pump factors. This shows how in a patient with a state of chronically poor cardiac pump (heart failure) the sequelae of volume overload, worsened electrolyte imbalances, and higher myocardial O2 demand (given the ramped up pump factor) can help with survival but ultimately further damage the heart, kidneys, and lungs.
Here is my version of the same busy arrow-filled chart that you see everywhere illustrating the hemodynamic changes in various shock states. I include what I feel are some of the most common iatrogenic sub classifications. It also bears noting the reasons these values can be invalidated:
It’s rare that we have an echocardiogram, PA catheter, L/R heart catheterization, or other device in place early on to give us this data. Once we do, it is typically after we have administered treatment so data will be skewed. They are likely already on pressors, inotropes, or have received volume resuscitation, etc.
It’s common that patients have multiple shock etiologies co-existing. For example, the septic patient who then has reduced po intake which compounds the issue with hypovolemia.
The clinical picture of the patient, from history to exam, often does not reflect the textbook definition. For example, we have all been taught that the septic shock pt has warm and dry skin. This is 2/2 the state of vasodilation. But in later stages they will be cool. Any state in which the cardiac perfusion is poor enough will reduce blood flow to a point that supersedes the vasodilatory warmth factor. So essentially all shock states can make a pt feel cold.
Therefore, this chart is meant to be used as a guide to start your decision tree. Like anything else in medicine, it’s just one set of data to contribute to the overall picture leading you to the “most correct” diagnosis.
This is a brief overview of shock and I hope you find it helpful to build your practice. If you would like more education like this go check out the acute care lab membership. This highly valuable resource provides 2 biweekly live lectures via zoom, links to PDF templates, guides, and checklists created for the subject as well as exclusive perks like free versions of the H&P cheatsheet and discounts only offered to members for new products/services. In this week’s lecture we discussed shock in depth with case studies and lots of helpful tips for practical application. Despite my use of necessary evils like equations 😣 I hear feedback that my style of education is very applicable - and that is my goal! The next live session will cover interpretation of chest xrays.


